
Semiconductor engineering
A wafer of data.
A clearer picture.
See measurements in physical space. Connect the die, parameter and wafer with the patterns that deserve a closer look.
Explore the wafer views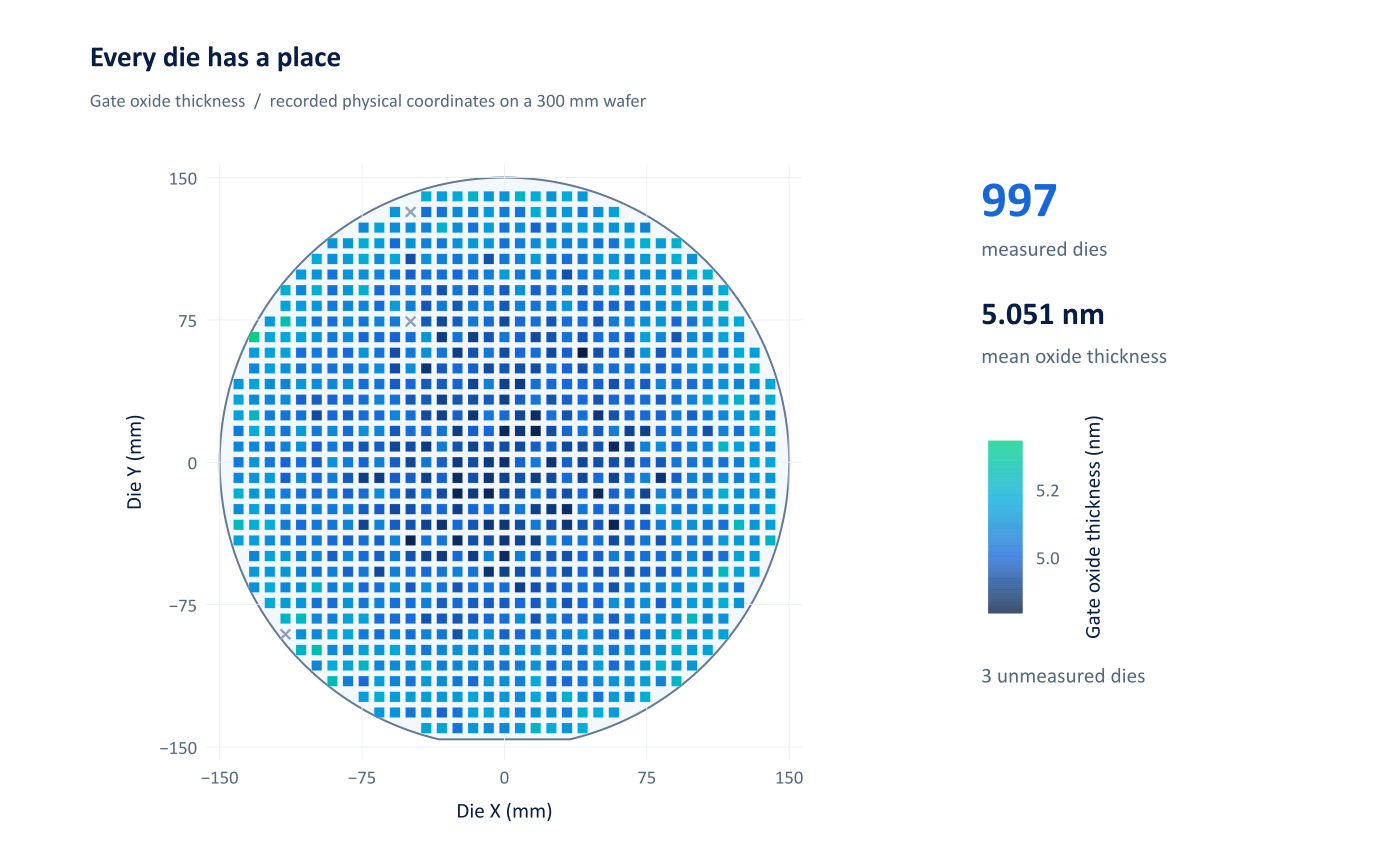
Read the spatial pattern, then check the parameter, units and wafer identity. This demonstration preserves physical die coordinates.
Multi-wafer exploration / application scene views
Keep every wafer
in the picture.
See separate wafer identities on a shared canvas. Move between die maps and contour views while preserving the coordinate and parameter context.

Vector view from a verified final 1501 application scene; see Terms & validation for provenance and test scope.
Keep the context
One die.
Part of a larger story.
A useful map connects the spatial pattern with the measurement and its place in the process.
- 01
Wafer and die identity.
Keep wafer identities with their die X/Y positions when exploring multiple maps.
- 02
Parameters in view.
Explore measured values, status and parameter context in the appropriate map view.
- 03
Connect space and variation.
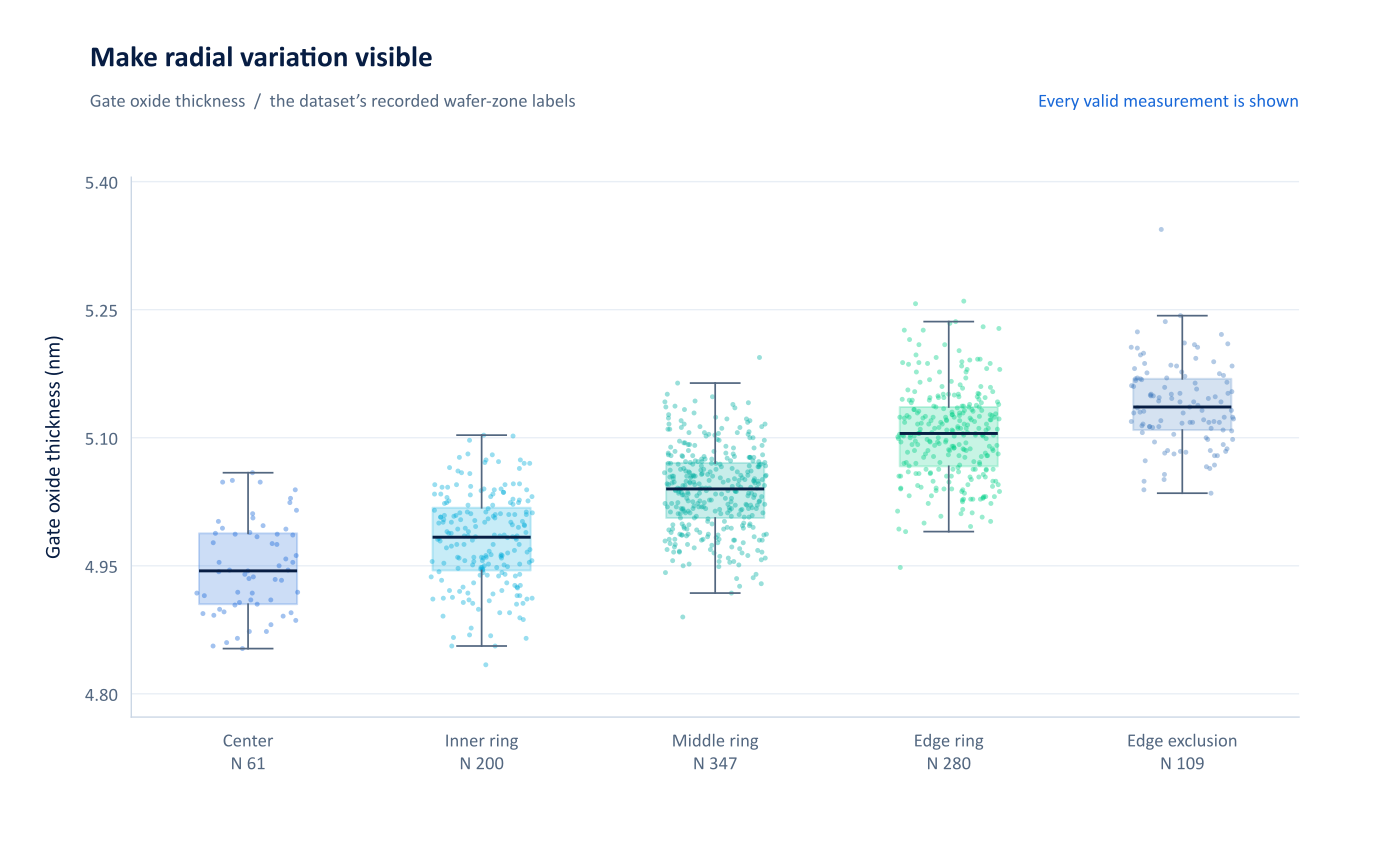
Move from the wafer to a zone comparison, a distribution or a relationship between measurements.
Beyond the map
The next view
is part of the insight.
Compare zones, inspect distributions and connect a spatial observation with the rest of the engineering data.
Explore the analysis workbenchBring your engineering question.
Explore how Numetiva fits your data, workflow and review requirements.