Visual workflows & Python

Good work.
Worth repeating.

Connect preparation, analysis and output. Save the useful sequence. Return to the next question with a clearer starting point.

From source to insight

See the sequence.
Keep the logic.

Build a visual flow, save it as a reusable template and run it again when the next dataset arrives.

Interactive product tour Workflow preview
↥01 / SourceConnect dataCSV · Excel · ODBC
↔02 / PrepareShape & harmoniseFilter · transform · join
∿03 / AnalyseSee the responseStatistics · charts
✓04 / OutputKeep the evidenceReview · save · share
✓ A saved sequence, ready to run again.Explore the workflow

Connected-source monitoring

Follow the data
as the source changes.

Refresh a workflow from saved CSV, Excel or an existing ODBC source. Inspect the changing preview, then publish a project snapshot when you choose.

Discuss your production workflow
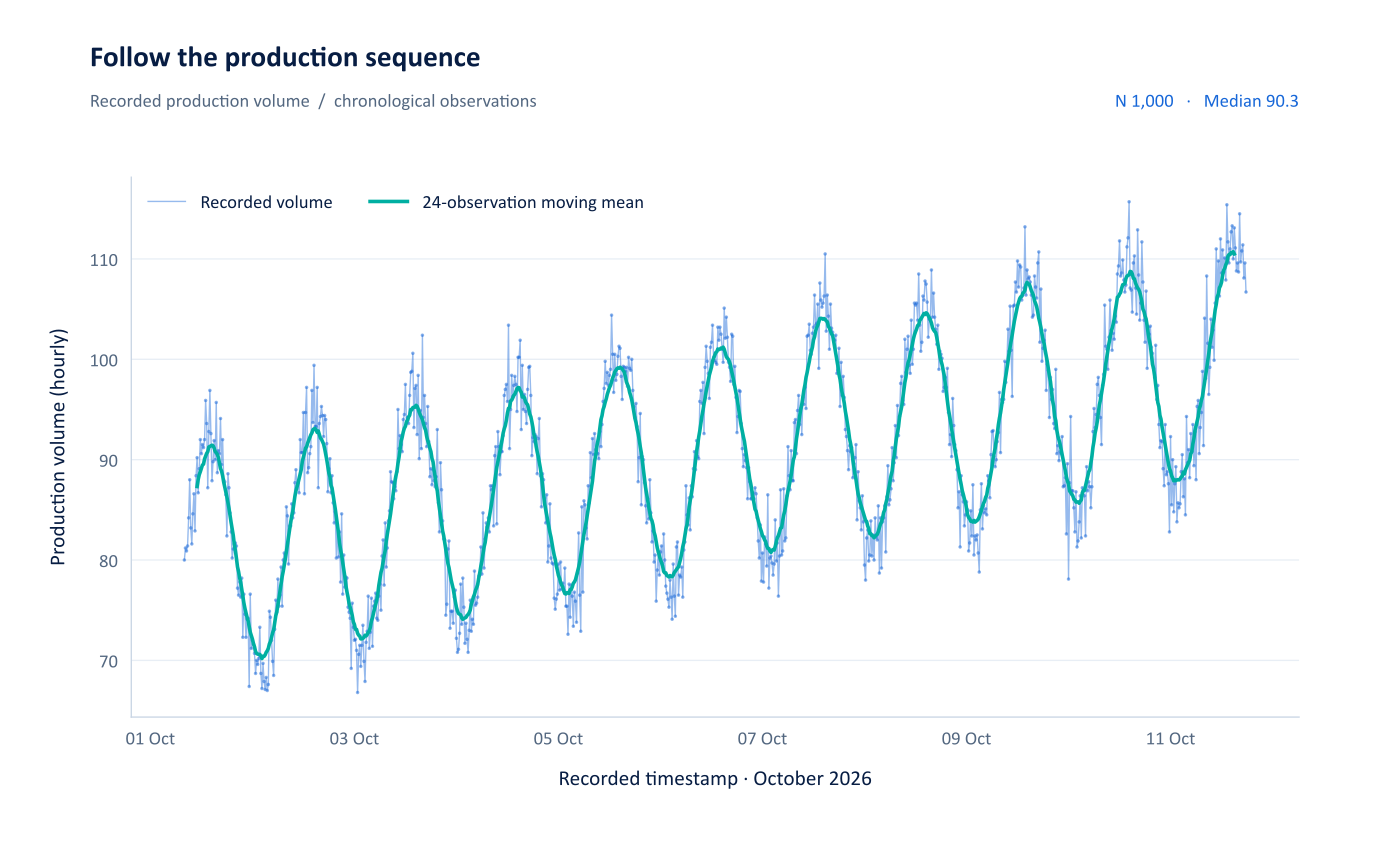
A process, over timeNUMETIVA
Python-generated time-ordered tool-wear chart showing the recorded engineering demonstration sequence.

Numetiva AI & Python workbench

From an idea
to something you can run.

Create a draft, inspect the script and run it locally with your worksheet. Keep output, errors and the next question in the same workflow.

N / 03

Stay close to
the work itself.

Use Create with AI for a starting point. Use Review / fix with the current script and its latest error. Return to the output when you are ready to inspect the result.

Interactive product tourOn your PC
YOUR QUESTION

“Plot tool wear against vibration, and add a quadratic fit.”

Numetiva AI

Turn the question into a script you can inspect.

Python workbenchDraft
import numpy as npimport matplotlib.pyplot as pltx = df["Tool_Wear_um"]y = df["Vibration_RMS_g"]ax.scatter(x, y)fit = np.polyfit(x, y, 2)

PABLE / repeatable engineering work

Write it once.
Run the useful steps again.

Keep local batch recipes, parameter selections and loop steps together. Return to a saved recipe when another file, group or engineering question arrives.

01 / PREPARE

Start with the worksheet.

Choose the inputs and inspect the columns before building the recipe.

02 / RUN

Work through the batch.

Use saved steps and loops to repeat the defined operation across the chosen inputs.

03 / REVIEW

Keep results in view.

Inspect outputs and errors, then retain the useful results in the project.

Your deployment environment

Local operation.
A deliberate choice.

Keep statistical calculations, configured offline AI and Python execution on the Windows PC. Plan the sources, packages and permissions around the environment where the work will run.
Discuss a local deployment

Bring your engineering question.

Explore how Numetiva fits your data, workflow and review requirements.

Talk to Numetiva
Numetiva / vector chart
100%Open SVG ↗

Zoom for individual dies and labels. Drag or scroll to pan. + / - to zoom; 0 to fit.

Numetiva / interactive product tour

From a question to a checked output

Your question.
A reviewable script.

Use the assistant to draft Python, inspect the code in the workbench, then run it against your worksheet. Bring the latest error into Review / fix when the script needs attention.

  1. 01
    Ask with context.

    Name the response, predictors and the chart you need.

  2. 02
    Inspect the draft.

    Check the column names, transformations and method.

  3. 03
    Run and review.

    Use the returned output and errors to guide the next step.

Explore AI & Python
Python / exampleWorksheet context
import numpy as np
import matplotlib.pyplot as plt

x = df["Tool_Wear_um"].to_numpy()
y = df["Vibration_RMS_g"].to_numpy()
valid = np.isfinite(x) & np.isfinite(y)
x, y = x[valid], y[valid]

fig, ax = plt.subplots()
ax.scatter(x, y, s=18, alpha=0.7)
coefficients = np.polyfit(x, y, 2)
grid = np.linspace(x.min(), x.max(), 200)
ax.plot(grid, np.polyval(coefficients, grid))
ax.set(xlabel="Tool wear / µm",
       ylabel="Vibration / g")
plt.show()
About this product tour